
We built the Positioning Gallery to answer a simple question: how do cybersecurity companies actually position themselves? Not what they think they're saying, but what their homepage, messaging, and competitive framing actually communicate to buyers. After scoring 300+ companies across 7 dimensions, most are invisible.
The average composite score across our dataset is 46.5 out of 100. Only two companies out of 300+ broke 75. The vast majority sit in a commoditized middle, saying the same things in the same way, indistinguishable from their competitors.
The distribution
When you score 300+ cybersecurity homepages on a 0-100 scale, here’s what you get:
| Score Range | Companies | % of Gallery | What It Means |
|---|---|---|---|
| 75+ | 2 | 0.6% | Exceptional — clear category, sharp differentiation, real evidence |
| 50–75 | 135 | 38% | Functional — has some positioning, but gaps weaken the story |
| 25–50 | 205 | 58% | Commoditized — sounds like everyone else in the category |
| Below 25 | 13 | 3.7% | Broken — buyer can't tell what you do or why you're different |
That middle band, 25 to 50, is where 58% of the market lives. These companies have a homepage, a product description, maybe some logos and a demo CTA. Nothing about their positioning would make a buyer choose them over a competitor.
What the top performers do differently
The two companies that scored above 75, HYPR (77.5) and Intezer (75.0), don’t share a category or a target buyer. HYPR sells passwordless authentication. Intezer builds AI-powered SOC automation. What they share is a positioning pattern.
They name the problem before the product. HYPR’s homepage opens with “Stop Insider Threats,” framing the entire buyer conversation around a pain point, not a technology. Intezer leads with the SOC analyst’s reality, not the platform’s feature list.
They prove it with named evidence. Not logo walls. Named executives from named companies describing specific outcomes. HYPR cites 324% ROI validated by a Forrester TEI study. Intezer quotes heads of security from enterprise customers with measurable workload reduction. Attribution builds credibility that anonymous metrics cannot.
They pick an audience. Neither company tries to serve everyone. HYPR speaks to security teams dealing with insider threats. Intezer speaks to SOC teams drowning in alerts. Specificity creates relevance, and relevance is what gets you on the shortlist.
Below these top performers, a handful of companies in the 70–75 range follow similar patterns: Zero Networks (74.5, Microsegmentation), SCYTHE (72.5, BAS), Zenity (72.0, AI Governance), and Nudge Security (71.0, SaaS Security). Each one leads with the buyer’s world, not the vendor’s product.
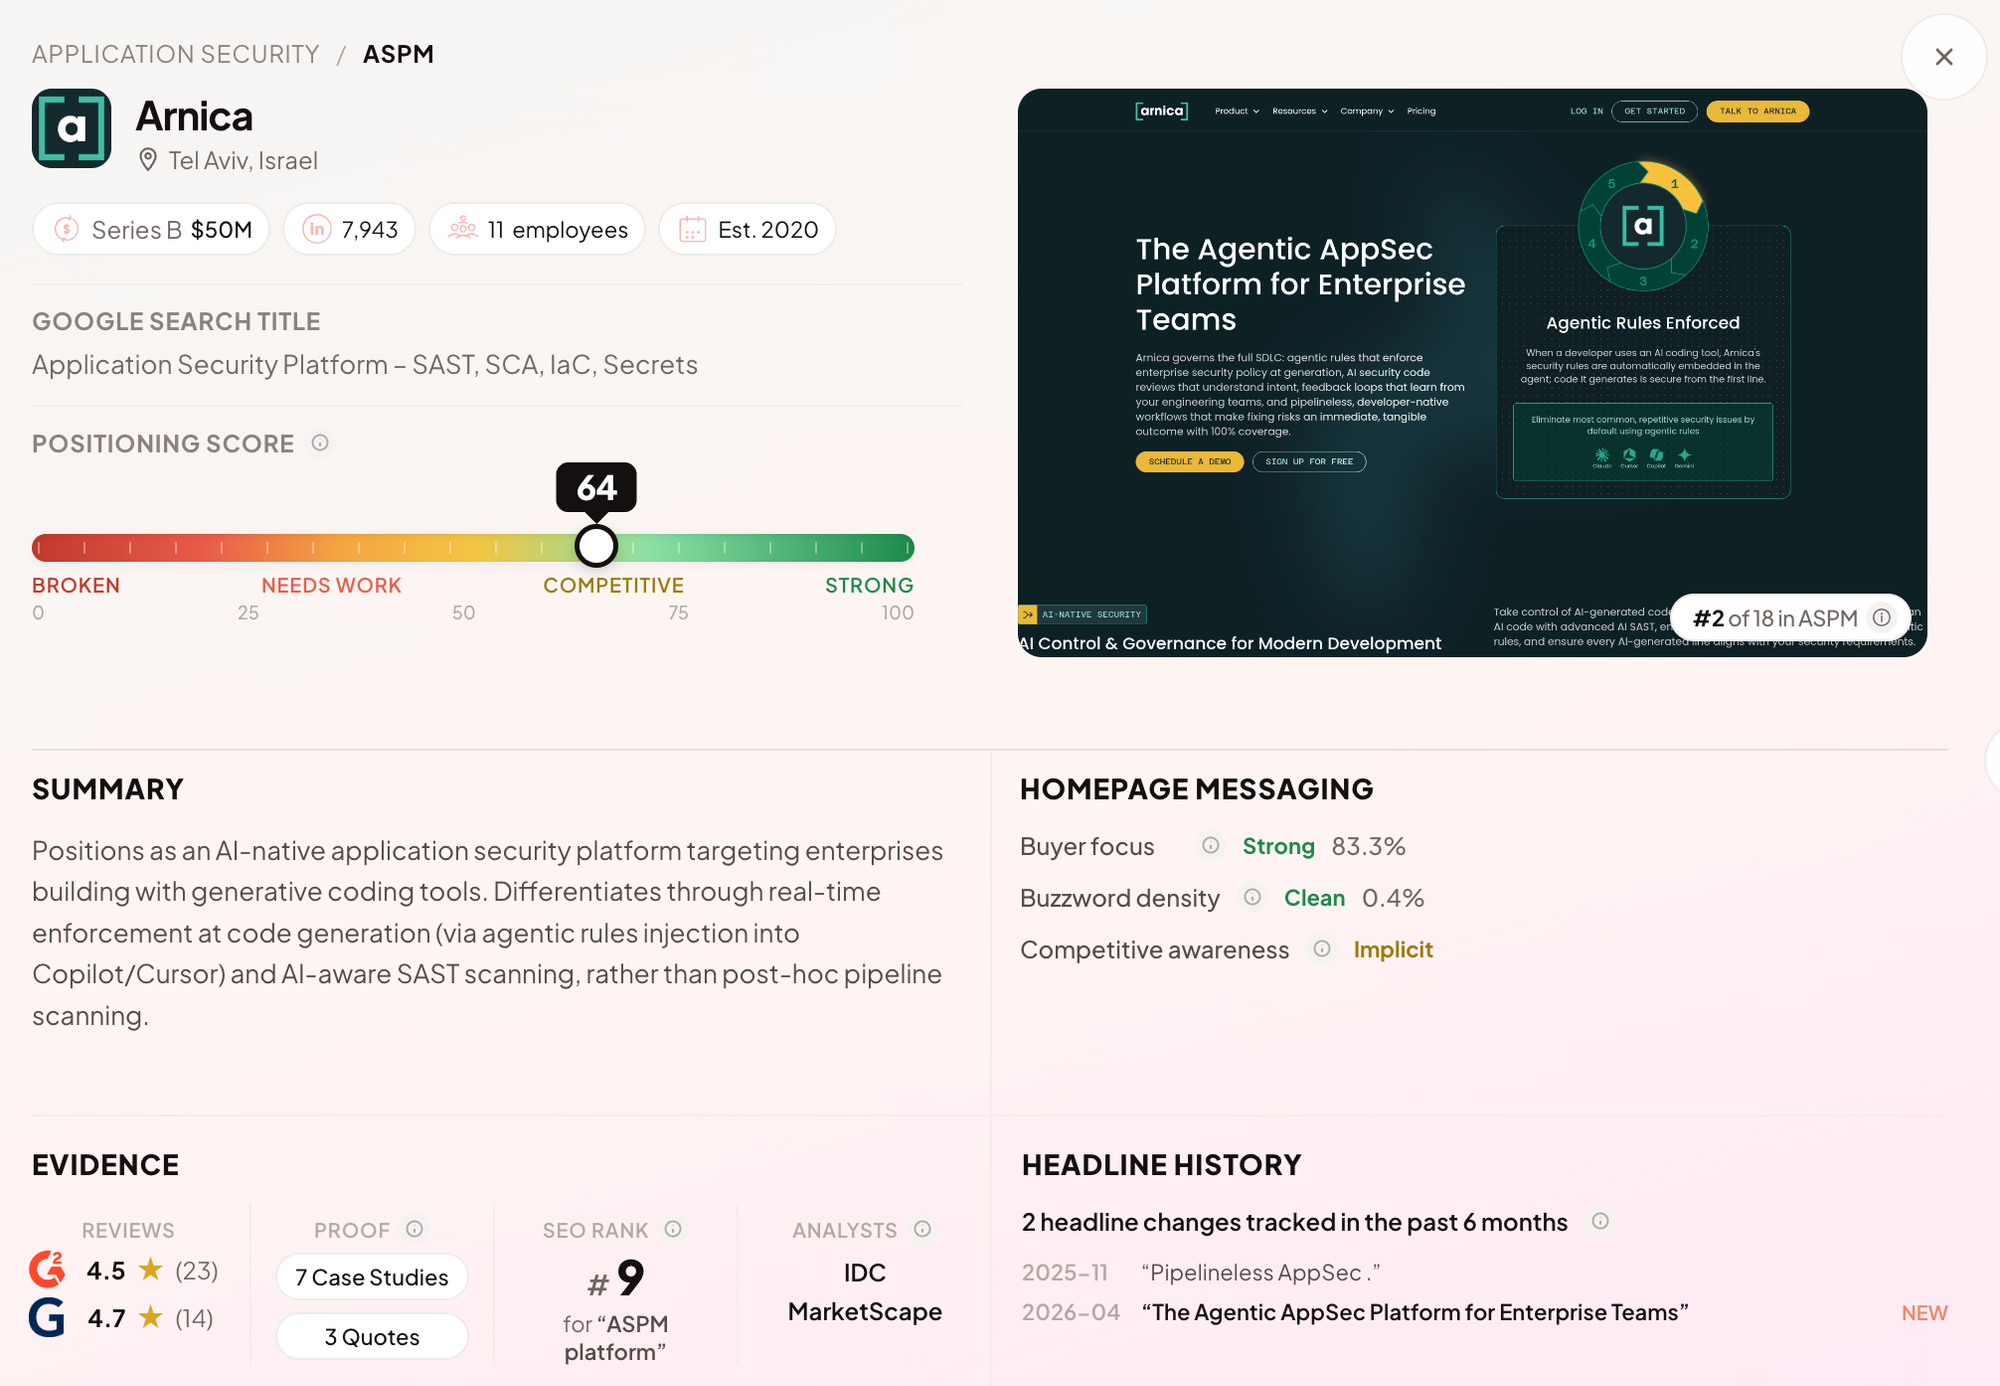
Explore the gallery.
The category gap
Not all sub-verticals position equally. Some categories have mature analyst coverage, clear buyer expectations, and vendors who’ve learned to differentiate. Others are still figuring out the basics.
| Category | Avg Score | Companies | Positioning Maturity |
|---|---|---|---|
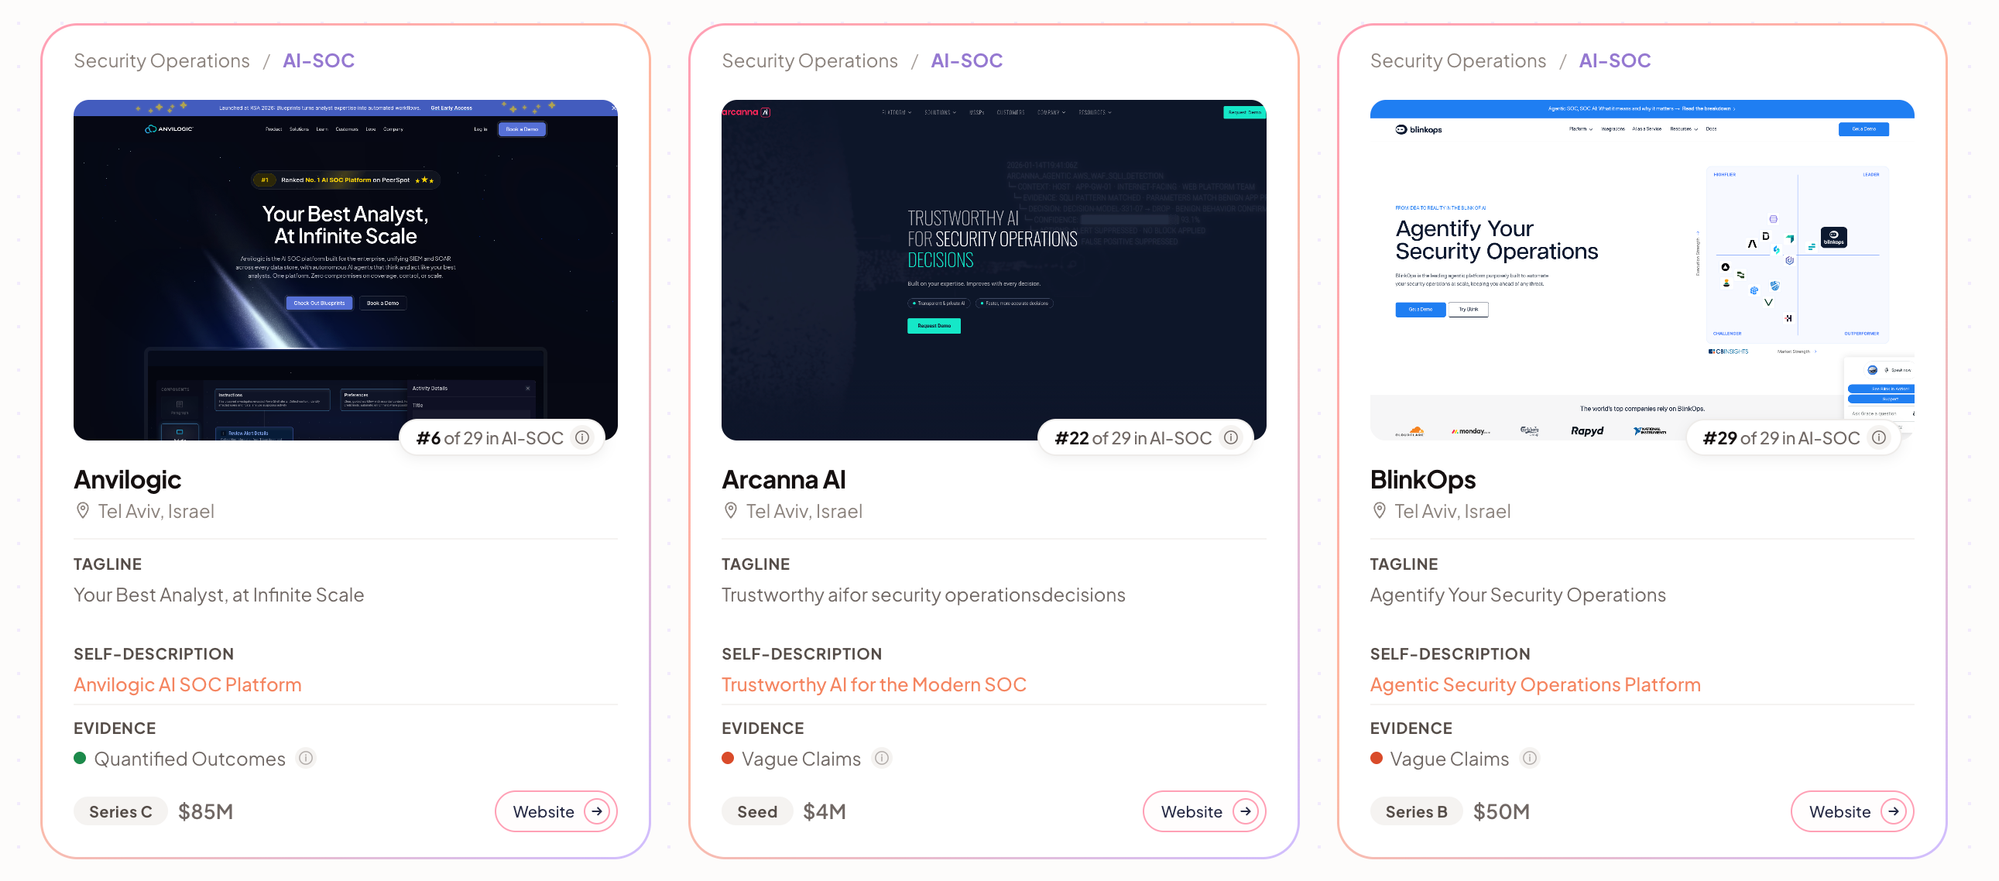
| AI-SOC | 56.0 | 28 | Strong — analyst consensus (Gartner Hype Cycle, SACR report) created shared language |
| Exposure Management | 50.4 | 49 | Mature — well-defined use cases, clear buyer expectations |
| Identity Security | 49.9 | 46 | Established — vendors know their differentiation vectors |
| AI Governance | 43.8 | 41 | Weak — explosive growth (36% CAGR) but category confusion |
| Data Security | 43.6 | 29 | Fragmented — Gartner identifies 5 DSPM subcategories that "bear only a slight resemblance" |
| GRC & Risk | 41.5 | 18 | Legacy — incumbents haven't modernized positioning |
The spread between the best-positioned category (AI-SOC at 56.0) and the worst (GRC at 41.5) is 14.5 points, nearly a full tier of positioning maturity. Categories with strong analyst consensus and clear buyer definitions produce better-positioned vendors. Categories without them produce noise.
The pattern that predicts everything
After scoring 300+ companies, one pattern emerges above all others: the companies that score highest talk about the buyer’s world first and the product second. The companies that score lowest do the opposite.
This is structural, not stylistic. Our scoring model evaluates seven dimensions, from category clarity to competitive framing to evidence quality, and the companies that lead with the buyer’s problem outperform on nearly every one. Not because we weight buyer-focus the highest (Value Differentiation carries the most weight at 25%), but because buyer-first positioning forces clarity on every other dimension. When you start with the buyer’s pain, you’re compelled to be specific about your category, precise about your differentiation, and concrete about your evidence.
When you start with your product, none of that is required. You can be vague about the category (“security platform”), generic about differentiation (“AI-powered”), and abstract about evidence (“trusted by leading enterprises”). Feature-first positioning lets you skip the hard work, and the scores reflect it.
What this means for you
If you’re a cybersecurity startup, the odds are against you. A 46.5 average means most of your competitors, and likely you, are lost in the commoditized middle. But that’s also the opportunity. When 58% of the market sounds identical, standing out doesn’t require being louder. It requires being clearer.
The companies in our Positioning Gallery that score in the top quartile share three traits: they name a specific problem, they prove their claim with named evidence, and they pick an audience instead of trying to serve everyone. That’s a positioning decision, not a marketing budget problem.
At a 46.5 average, your positioning almost certainly has gaps. The real question is whether you know where they are and which one to fix first.